


India’s Energy Transition and Carbon Regulations: A Key to Net Zero Outcomes


An evaluation of India’s Energy Conservation Amendment Bill
Climate change, impact, justice, finance and climate action are some of the biggest buzzwords of the ongoing decades. The direction energy transition takes is at the centre of it all.
The irreversible impact of the Anthropocene on the environment is now well-documented and globally accepted per the UNEP Paris Agreement of 2016.
One of the most widely accepted climate change measurements is illustrated via the Planetary boundaries.1 First proposed by Johan Rockstrom, the former centre director of the Stockholm Resilience Center, in 2009, it was later incorporated into other visual frameworks such as ‘doughnut economics’ by Oxford economics Kate Raworth who added complementary social boundaries.
As of their January 2024 measurement, 6 of the 9 assessed boundaries have been breached.
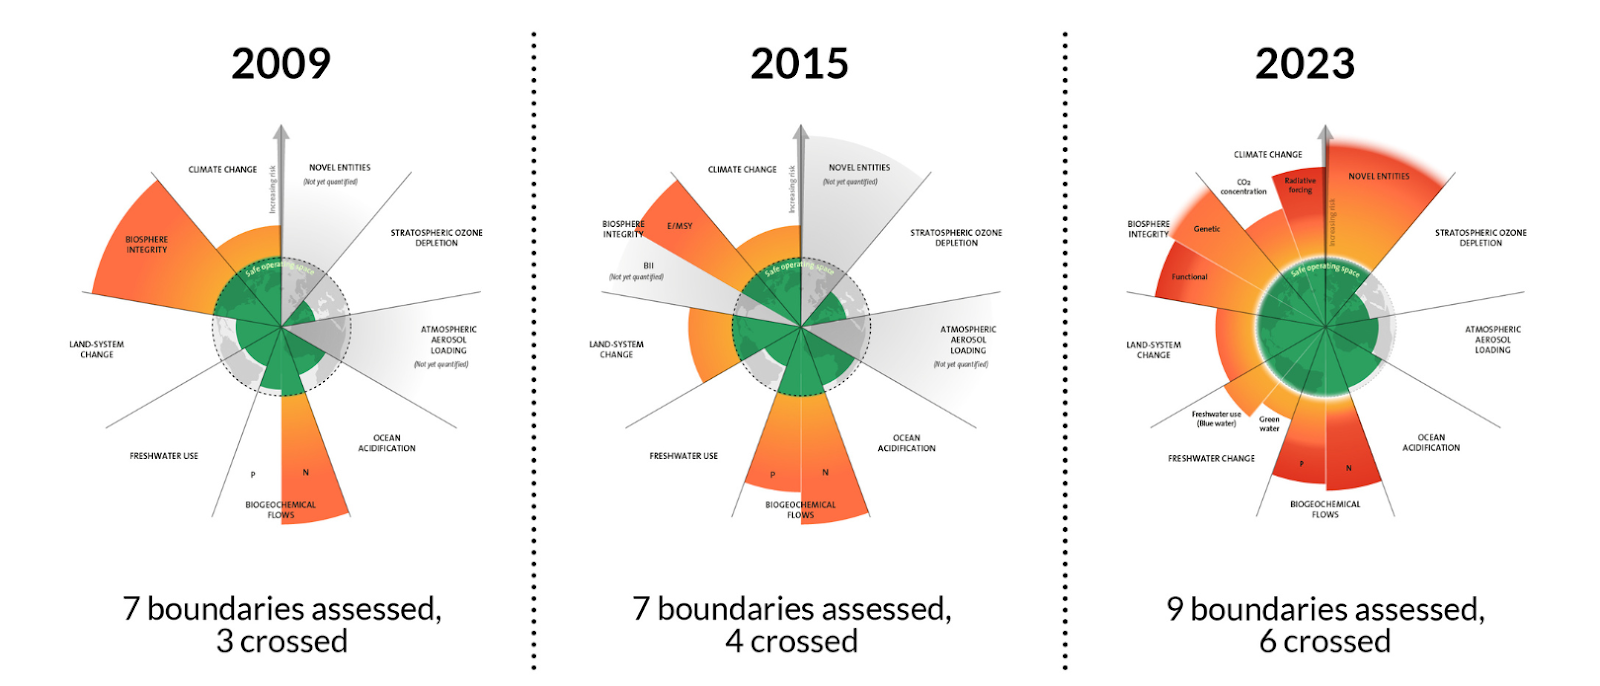
Figure 1: The evolution of the planetary boundaries 2009 – 2023
(Credit: Azote for Stockholm Resilience Centre, Stockholm University. Based on Richardson et al. 2023, Steffen et al. 2015, and Rockström et al. 2009)
The escalating climate crisis has undoubtedly fuelled global concern. The UN’s 17 Sustainable Development Goals and the international charter towards a Net-Zero future present us with an unprecedented opportunity.
With an exciting decade ahead, we strive to integrate environmental sustainability into our economic models swiftly and collaboratively — a fundamental shift unseen since the Industrial Revolution.
The primary culprit of climate change is energy. This means that the most significant shifts must occur under SDG 72 which focuses on the transition to affordable, clean energy. Currently, energy contributes to ~60% of Global Greenhouse Gas emissions. The shift to green energy is paramount to achieving net zero emissions.
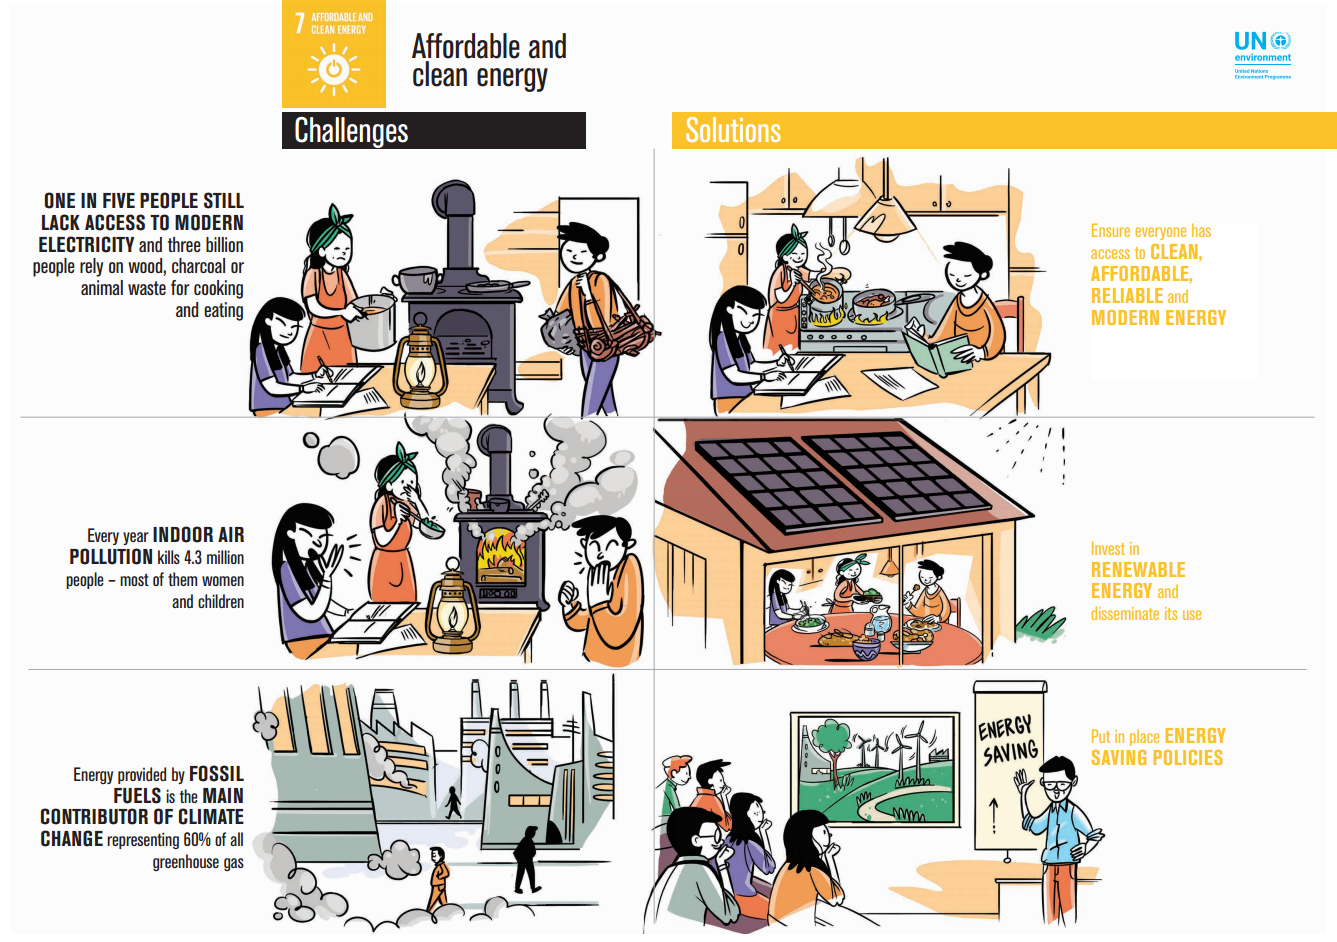
Figure 2: Affordable and Clean Energy forms UNEP’s Sustainable Development Goal 7
Historically, the majority of energy generation has been from geologically stored sunlight, i.e., coal and its derivatives. The discovery of access to this energy windfall translated into the rapid growth of human settlements.
However, in this system, we only pay for the cost of extraction, overlooking the costs of creation, the true value of these resources, and the pollution they produce. In his theories on ‘The Great Simplification’, Nate Hagens describes this phenomenon as Energy blindness.
A competitive edge to rapid development has turned habitual, and the Anthropocene needs correction to continue thriving.
Does India have a clean energy transition challenge?
The state of Energy production in India
As per its Nationally Declared Contributions (NDC) target to the UN, India is committed to 500 GW of clean energy production by 2030. Economic trends indicate that this would constitute roughly 50% of India’s total installed energy capacity. As of 2024, however, India sits at 198 GW3. This includes renewable energy sources like Solar, Wind, Bio Power, Nuclear, Hydro and Small Hydro sources, (refer Figure 3 below).
Between 2015 and 2024, the compound annual growth rate (CAGR) of installed electricity capacity was 4.2%, compared to 2.9% for per capita consumption. Of the total installed capacity increase, 8.6% of the CAGR has come from renewable sources, highlighting the momentum in India’s energy transition, while 1.6% has come from fossil sources (Coal, Oil, and Gas).
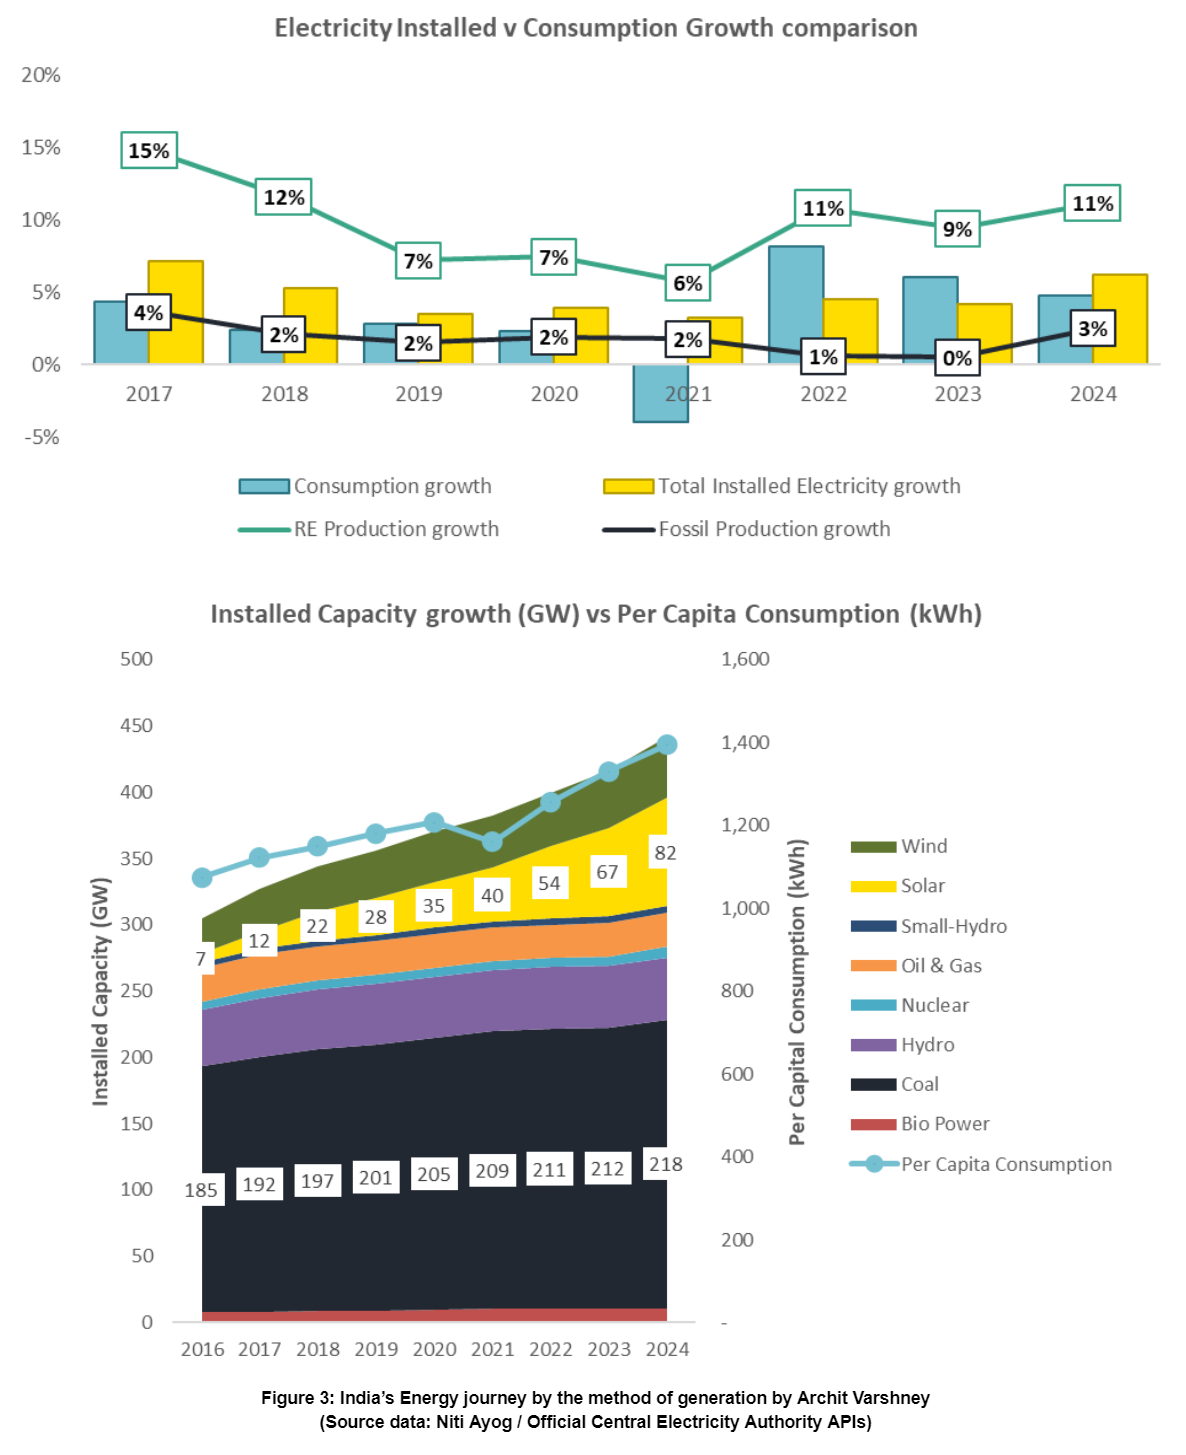
This undoubtedly signals positive momentum for India’s clean energy transition, both in keeping pace with the requirements of a nation growing consistently at ~7% GDP and in pushing the generation toward renewable energy sources.
Out of the total consumption of electricity in 2020-21(P)4, the industrial sector accounted for the largest share (41.09%), followed by domestic (25.67%), agriculture (17.52%) and commercial sectors (8.31%). The Domestic industry has experienced the highest CAGR of 7.02% between FY 2012 and FY 2021.
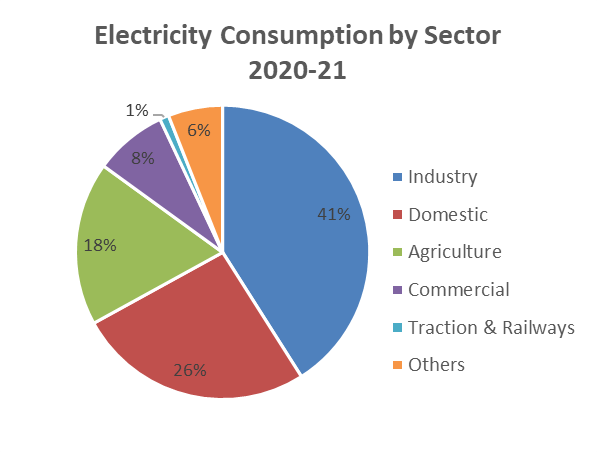
Figure 4: Energy Consumption by Sector in India (2020-21)
The widespread industrial sector involvement in energy generation and consumption has greatly contributed to the energy transition. A multitude of factors have incentivised this, briefly mentioned below:
- Reduced energy costs for businesses – solar electricity prices fell from Rs 6-7/kWh in 2013 to Rs. 2.5-3/kWh in 2024
- Compliance with regulatory pressure through policy support such as the National Solar Mission and National Wind-Solar Hybrid Policy (India’s commitments to the Paris Accord in 2016)
- Access to capital at lower costs
- Financial investment in India’s renewable energy since the early 2000s
- Production-linked incentives and a rise in private player participation
- Leveraging sustainability as a competitive edge using increasingly creative brand strategies and/or charging green premiums.
- Building energy security and resilience.
- Setting up and meeting corporate sustainability goals.
India’s Energy Transition Challenge
The above factors have added tailwinds to the renewable energy transition until 2024. However, India also ranks 3rd in the highest GHG emissions and is the 7th most affected due to climate change.
In 2023, India witnessed 318 days of extreme climate events, with 84% of its districts5 being directly exposed. According to a report by the Ministry of Environment, Forest and Climate Change in 2021, energy production and consumption contributed to a 75% share of emissions6 in India in 2016.
Having set a target to reach 500 GW of renewable energy by 2030, India’s renewable energy market faces a steep challenge over the next half-decade. To successfully drive the energy transition, it needs to double its current compound annual growth rate (CAGR) from 8.6% to 16.5%.
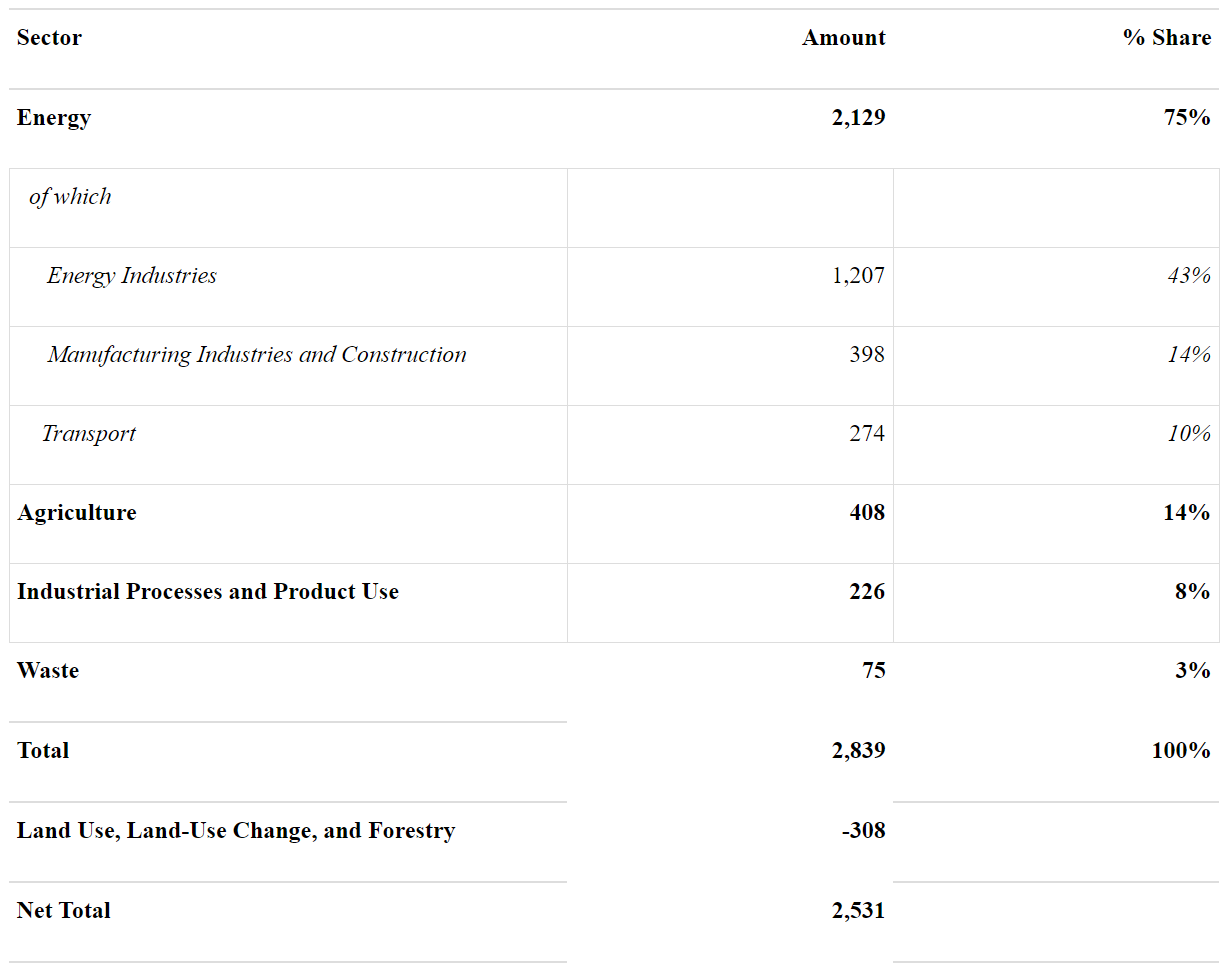
Figure 5: India’s Total Emissions by Sector as of 2023 (Million Tonnes CO2 equivalent) with Energy as the greatest contributor
Source: Table 2.35, India’s Total Emissions 2011-2016, Third Biennial Update Report to The United Nations Framework Convention on Climate Change 2021, Ministry of Environment, Forest and Climate Change; PRS India
The Energy Conservation Amendment Bill, 2022
While India has been working on its energy transition journey for the last decade, it now faces increasing challenges. The urgent need for infrastructure development and the climate imperative requires a closer examination of the factors affecting the pace of India’s clean energy transition.
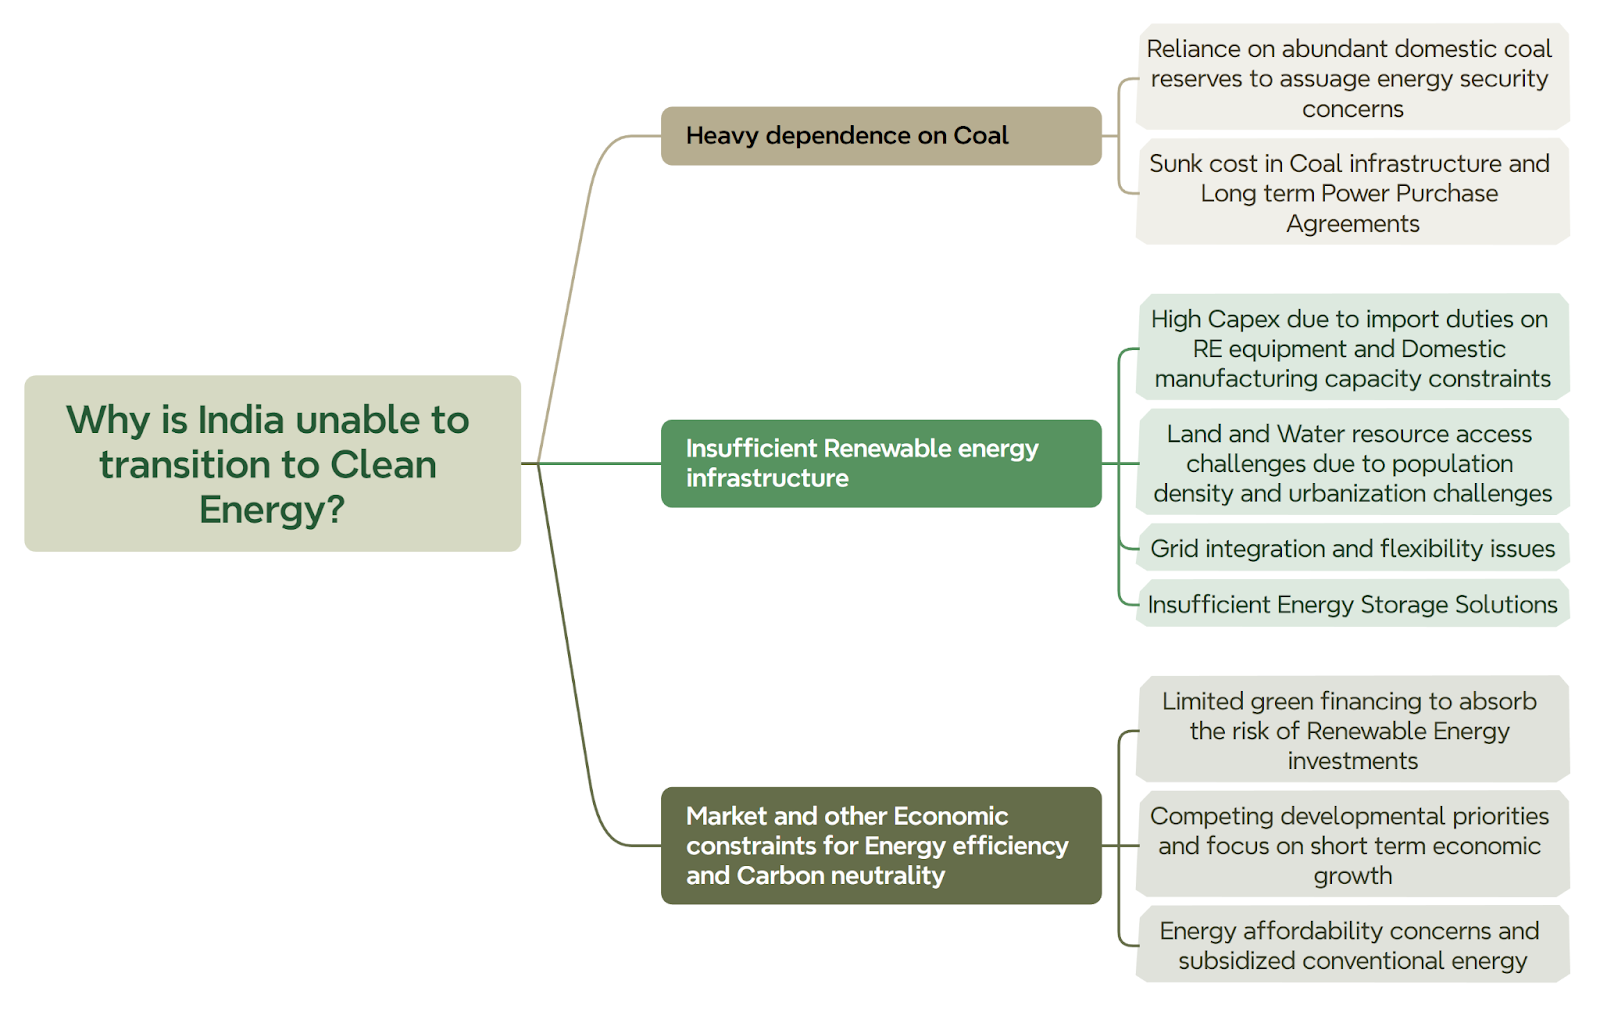
Figure 6: Root Cause Analysis for India’s Clean Energy Transition Challenge by Archit Varshney
The Energy Conservation Amendment Bill, 2022, passed by the Lok Sabha in December 2022, revises the energy policy established in 2001 and focuses on addressing some of these challenges.
The bill highlights 5 key changes:
- Introduces the Carbon Credit Trading Scheme (CCTS)
- Establishes obligations for ‘Designated Consumers’ to use a minimum share of non-fossil energy sources.
- Expands on an energy conservation and sustainable building code for built environment with a connected load of more than 100KW
- Extends energy efficiency standards beyond appliances to include vehicles and vessels for the first time.
- Increases penalties for non-compliance under the Energy Act for Designated Consumers, Vehicles, Vessels, Buildings and Appliances
- Diversifies and expands the composition of a governing council under the Bureau of Energy Efficiency (BEE).
A SMART evaluation of a policy bill’s goals attempts to infer whether it is Specific, Measurable, Attainable, Relevant and Time-bound
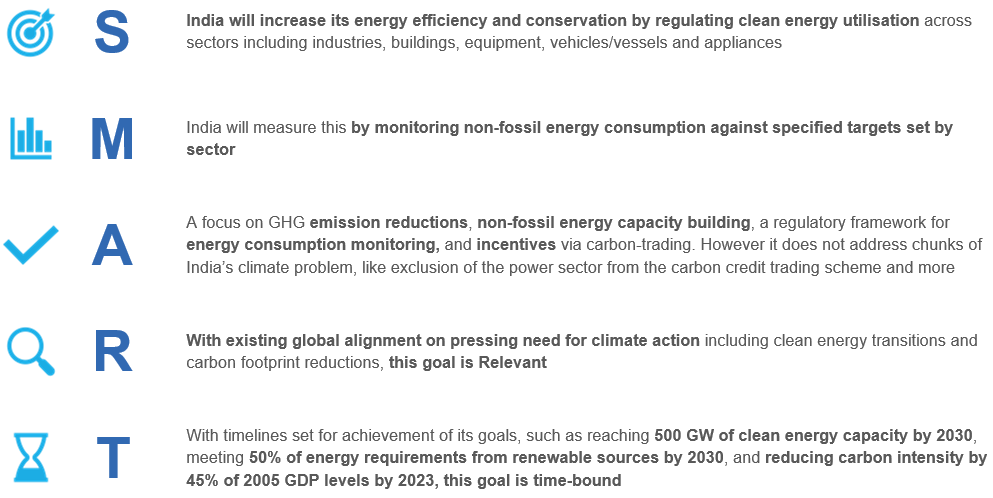
Figure 7: SMART evaluation of India’s Energy Conservation Amendment Bill, 2022 by Archit Varshney
The bill introduces welcome nudges to the market towards clean energy but falls short of making a decisive step towards a clean energy-friendly policy. The key issue of the bill’s ‘Attainability’ of goals is captured as challenges below, along with a few proposed solutions.
Key missing problem area #1: Unintended consequences of Energy Insecurity
- Carbon pricing norms and market stability mechanisms are missing from carbon market rules. Substantial evidence from existing carbon markets, including EU ETS, China CCES, Korea ETS, and even India’s own PAT scheme (discussed further in Key missing problem area #3), suggests that low market liquidity is one of the biggest points of failure. The primary trigger for the issue has been the uncertainty created around carbon prices and their trajectory.
This has led to a reluctance to participate in the market, resulting in the holding back of unused allowances for future periods in anticipation of more favourable pricing. Consequently, when all DCs meet their targets, it can lead to an oversupply and a lack of real demand ‘pull’ in the market, as previously observed with the price failure of Renewable Energy Certificate (REC) in India. - The Energy conservation bill does not provide any incentives to boost imports or to promote research and manufacturing in the renewable energy reliability segment. Given the lower Plant Load Factor (PLF) and seasonal nature of solar, storage and hybrid solutions such as Solar-Wind farms are crucial for ensuring reliability. A study in Chapter 6 of the Economic Survey of India in 2024 compares the cost of Renewable Energy against Renewable Energy + Storage. In contrast, it should have compared Renewable Energy + Storage with coal-based electricity to reflect broader benefits. The absence of a comprehensive perspective indicates a policy hesitance to turn renewables mainstream.
Some energy market experts have gone a step further by placing an economic cost to India’s current transition to clean energy7 calling it much ‘slower than possible’. For example, a case evaluation postulates that Rajasthan DISCOMs will incur a recurring additional cost of Rs.1800 Cr/year due to the ongoing construction of the Kawai Coal plant. These costs stem from DISCOM losses in capital expenditure setup and a much higher cost of coal-based electricity operations.
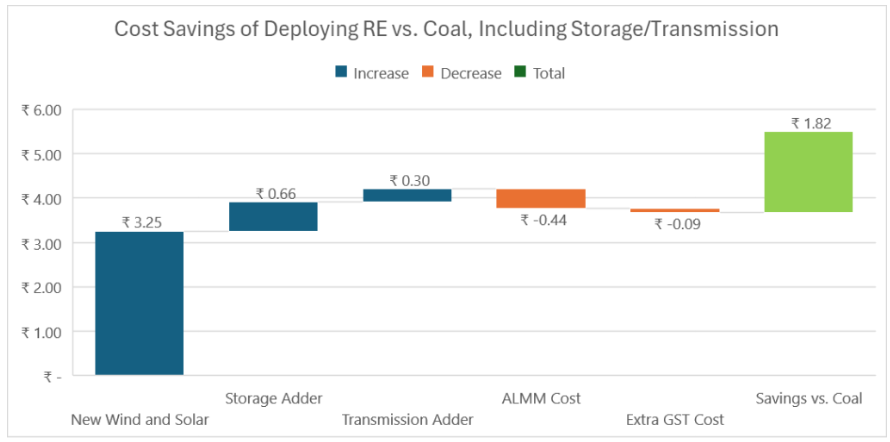
Figure 8: Savings of building new Savings of building new RE with storage and transmission vs. new coal. Storage and Transmission adders taken by adding CEA’s projections for storage and transmission requirements to integrate 500 GW of RE by 2030, amortised over the units generated. ALMM and GST calculated based on the per unit adder to RE from these additional costs imposed by RE
Source: How Much Would India Have Saved if it Had Met Its RE Targets (Updated) by EnergywithAlex, Published on September 7, 2024
The argument suggests that in comparison, other large developing nations, such as China and Brazil, despite having a slower population and GDP growth, are progressing much faster in their clean energy transitions. This might reflect deeper issues related to the lingering perception of fossil vs renewable energy as a development vs climate debate.
Additionally, the continued mandates favouring fossil fuel imports; and the continued nomination for coal power plant projects instead of an inclusion into cost-based tendering evaluations done for renewable energy projects have contributed to an energy transition that is at least 85 GW behind in wind energy and 116 GW behind in solar energy as of 2024.
- The exclusion of the thermal power sector from the CCTS is seemingly problematic. In doing so, the government leaves out the largest producer of emissions from its most significant carbon reduction initiative. While the sector is part of the PAT scheme, it remained the only sector that did not meet its targets under PAT I, and no penalties were imposed for non-compliance.
India’s third official National Communication to the UNFCCC reported that the electricity sector contributed to 39.2% of the country’s total GHG emissions. Emission Trading Schemes (ETSs) across the globe have started with the power sector, and its exclusion, citing transition challenges, should not become a bottleneck for India’s decarbonisation journey.
Key missing problem area #2: Policy Implementation and Adoption
- Adherence to the PAT scheme timelines has been a problem in the past for both governing bodies as well as accountable DCs, (refer Figure 10 below). No additional steps seem to have been taken towards consolidating and tightening the government’s MRV auditing initiatives.
India’s National Action Plan on Climate Change (NAPCC) was introduced in 2008, and as part of this, India introduced the Perform, Achieve and Trade Scheme (PAT) in 2012. The scheme aims to enable a market-based mechanism to increase energy efficiency in the industrial sector by setting benchmarks that facilitate trades between achievers and defaulters via Energy Saving Certificates or (ESCerts).
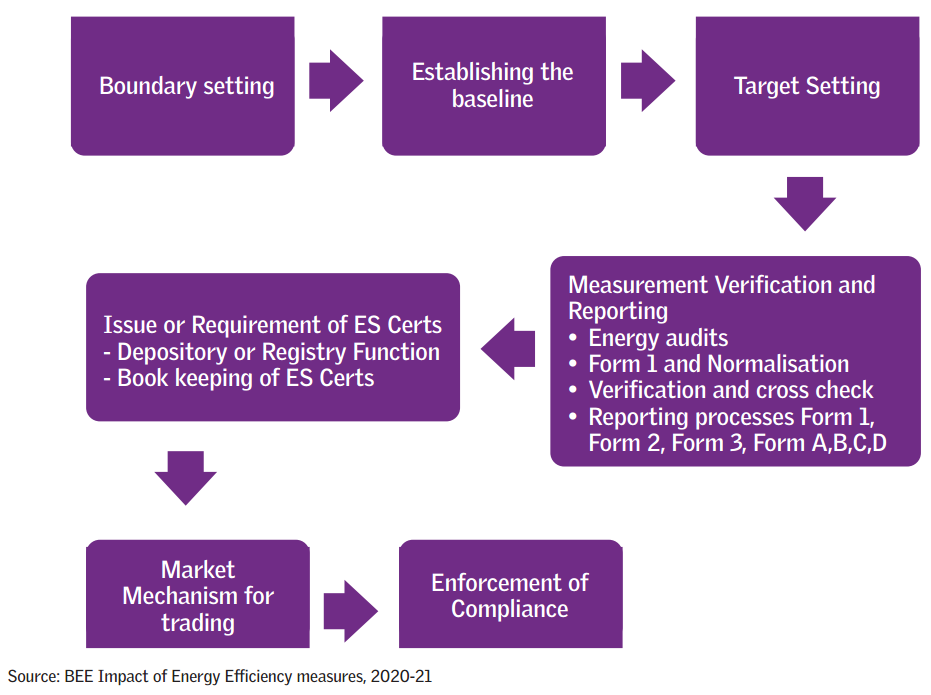
Figure 9: PAT Scheme process in India, Credits: CSE Report8
However, the scheme’s design has allowed for post-effect and multi-year assessments, which has led to delays in assessment and compliance, (Figure 10 shows Assessment for the year 2018-19 is still in progress in 2024). Additionally, target setting across the major polluting sectors has been far too lenient to accomplish significant environmental goals. This has contributed to a demand slump on ESCerts, thereby flooring their prices – an apparent market failure to commoditise energy efficiency in India.
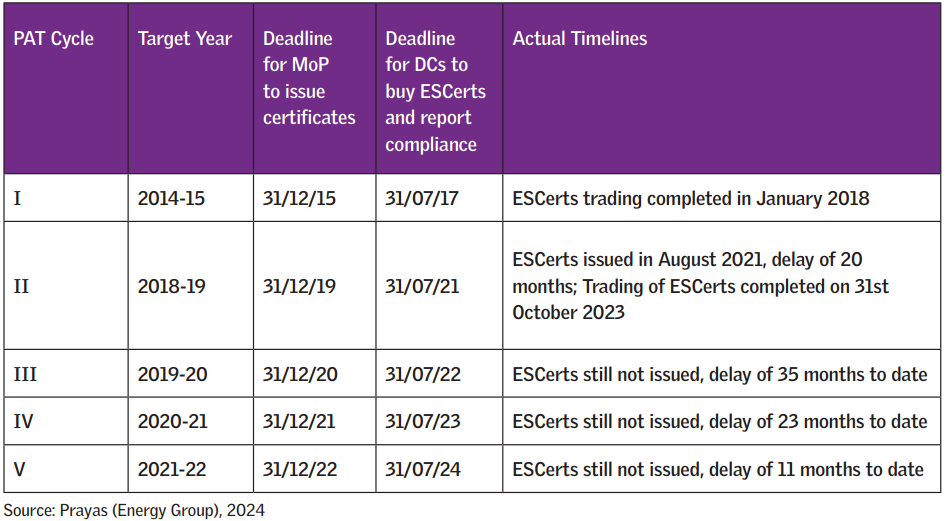
Figure 10: Lagging Deadlines under PAT Scheme in India, Credits: CSE Report8
Additionally, Implementation complexities are compounded by the apparent decision to layer CCTS on top of the PAT scheme. While CCTS is perceived to come into effect sometime in 2026, DCs have already been notified of the PAT cycles for 2025-26. Plans are also in motion to align PAT cycle goals for DCs with CCTS targets. There are additional concerns for entities that fall under both PAT and CCTS, such as whether they will have sufficient incentives and the appetite to meet both targets
- Mechanisms to set up Data reporting and ensure Integrity are missing. Data availability is widely accepted as one of the biggest impediments to the green energy transition, and companies require multi-year digital overhauls to set up reliable, sustainable reporting cycles.
China’s CCES has also encountered serious instances of falsification in emissions reporting data, with discrepancies of up to 1 million tonnes of CO2, valued at USD $7 million in allowances, which constituted over 10% of the power manufacturer’s emissions.
And while there have been future notifications by the BEE regarding the measurement, checking, and verification processes for the CCTS, significant questions remain about data availability, the lack of transparency, the reporting capabilities of small and medium businesses, and the authenticity of large businesses in sharing data on raw materials and fuels, which are typically not well organised.
Key missing problem area #3: Evaluation of resources and Adequacy planning
- Grid infrastructure, land grading and water conservation are all critical initiatives for successful green energy transitions. This is relevant across the board, not just for industries, where energy transitions will form the largest part of their net-zero journeys, but also for domestic solar, which accounts for nearly 26% of India’s energy requirements. Green energy projects could benefit from:
- Faster grid network integrations for renewable energy projects9; and the grid’s ability to accommodate bidirectionality and handle higher loads
- Identification of commercially and technologically feasible areas for renewable project development via land grading
- Water conservation laws and balance groundwater extraction with freshwater reservoirs for surface water storage. These form critical resources for green hydrogen production and utilisation.
A recent study by the Council of Energy, Environment and Water (CEEW) finds that to achieve net zero by 2070, India needs 7000 GW of renewable energy capacity10. A deep dive into their analysis reveals that scaling clean energy may be an increasingly uphill battle. The following are a few examples of the headwinds ahead for India’s next phase of clean energy expansion:
- Land access, land disputes, land prices and PLF
- Water access and reservoirs
- Material availability
- Future phases will require massively fragmented residential and agricultural solar transitions. This needs:
- Bi-directional metering
- Increased participation by Private players
- Grid infrastructure to support additional electrons
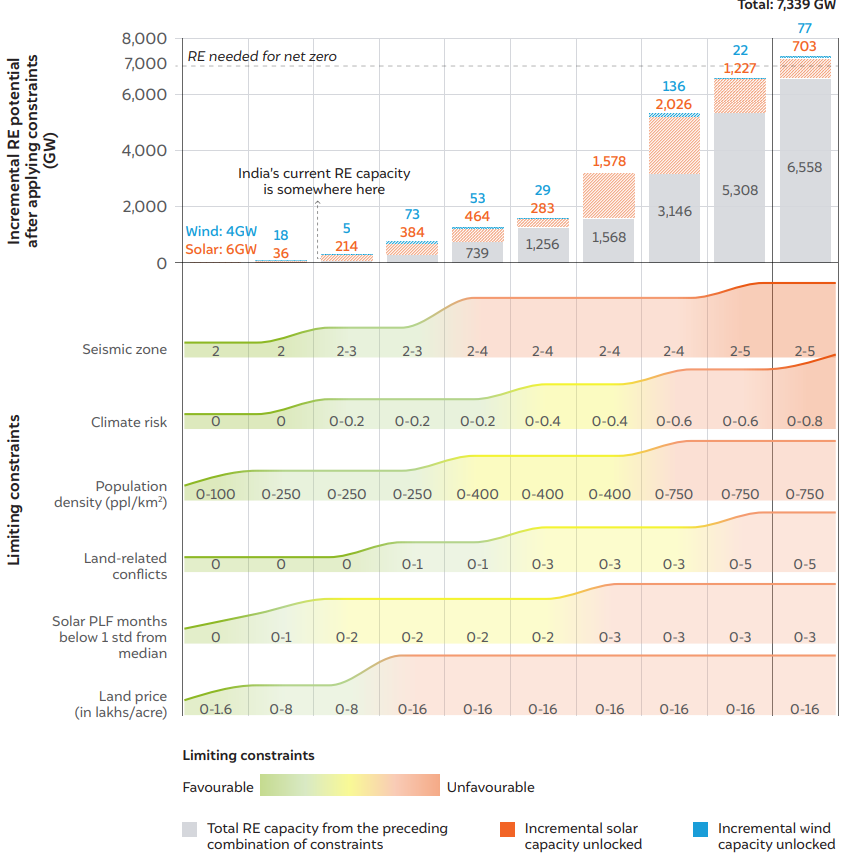
Figure 11: Scaling up Renewable Energy projects in India
Source: (CEEW Report) Unlocking India’s Renewable Energy (RE) and Green Hydrogen Potential, Published Sep 2024
A summary of the findings in the chart above:
- The first 60 GW deployment has no significant constraints.
- Between 60 GW and 300 GW capacity, the intermittency of RE increases slightly, with locations experiencing two months of generation lower than one standard deviation from the median. Additionally, locations with existing conflicts will have to be used for RE deployment. Out of 80 MTPA green hydrogen production capacity in WSH areas, 56 MTPA do not face any significant water availability challenges
- The 300–750 GW range has a trade-off between significantly higher land prices (between INR 8 and 16 lakhs per acre) and higher population density (between 250 and 400 people per square kilometre). Additionally, areas with higher population density are also associated with higher climate risk and conflicts. The climate risk also increases from 0.2 to 0.4.
- Beyond 750–1,500 GW, RE will need to be deployed in areas characterised as earthquake-prone zone 4 or in areas with higher seasonality, where generation is lower than one standard deviation from the median generation for three months. For the 1,500–3,000 GW range, we need to access high population density areas with 400–750 people per square kilometre. Unlocking the 3,000 GW RE potential will also require exploring land resources in high-conflict zones.
- Finally, beyond 3,000 GW, challenges associated with all constraints, from land price to population density and conflicts, increase. At the extreme of more than 5,000 GW, we need to deploy RE in highly earthquake-prone zones. Additionally, climate risks are quite high in some areas as we reach higher capacity requirements.
Conclusion
Climate change has far-reaching consequences for a country like India, which faces extreme climate conditions. It is pertinent to perceive it as not just a meta-crisis with economic, environmental and societal ramifications but an opportunity to create vibrant economies and societal well-being. The clean energy transition requires long-term and decisive policy guidance to factor climate into the market equation.
As the journey towards SDG 2030 plays out, some key recommendations for future energy regulation and amendments are as follows:
- Clarified vision for emissions control, measurement and the associated penalties for DCs and third-party reporters/auditors
- Decisive target setting that moves the needle on emissions reduction and natural resource degradation
- Mechanisms to improve data integrity with higher frequency inspections and audits
- Stricter MRV rules to prevent greenwashing, data fraud and manipulation
- Driving application of and imposition of stricter penalties that prevent non-compliance, as was the case with the PAT Scheme8
- Clarified vision for future energy sources and market-building regulation
- Re-evaluation of high Basic Customs Duties on solar and battery imports as the Indian market matures to compete with imports
- Prototyping, expansion and incentivisation of solutions like the Unified Energy Interface (UEI) based on the beckn protocol 11. Policy pushes to democratise energy production and consumption beyond EVs.
- Cross-industry and global view on the energy transition
- Include the largest emitters of carbon, i.e., the Energy sector, into India’s carbon trading scheme
- Keeping pace with internationally evolving regulations around air emissions, land, forest and water conservation as an instrument to build a globally competitive green market
- Resource building for public and private players via data reporting regulation and renewable energy-friendly policy visions for energy infrastructure, land and water
- Open data protocols such as Persues by Icebreaker One12 are applications that can unlock the complexity with free information, and insights flow across the energy value chain
Note: This blog post is based on the the practicum, submitted by the author as a part of final submission for LokNeeti, Class fo Feb 2024!
Register your Interest to Study at ISPP
References:
- Richardson et al. 2023, Steffen et al. 2015, and Rockström et al. 2009. Planetary boundaries framework. https://www.stockholmresilience.org/research/planetary-boundaries.html
- UNEP Sustainable Development Goal 7: Affordable and clean energy. https://www.unep.org/topics/sustainable-development-goals/why-do-sustainable-development-goals-matter/goal-7-affordable
- Data sourced from:
- Central Electricity Authority Data. APIs. https://cea.nic.in/api-for-central-electricity-authority-data/?lang=en.
- Niti Aayog. India Climate & Energy Dashboard. https://iced.niti.gov.in/
- Ministry of Statistics and Programme Implementation. Energy Statistics of India, 2024 Chapter 6. https://www.mospi.gov.in/publication/energy-statistics-india-2024-1
- IPE Global and ESRI India. Managing Monsoon in a Warming Climate. https://www.esri.in/en-in/events/climate-action/addressing-climate-extremes/policy-brief
- India’s Third Biennial Update Report to The United Nations Framework Convention on Climate Change 2021. https://unfccc.int/sites/default/files/resource/INDIA_%20BUR-3_20.02.2021_High.pdf
- How Much would India have saved if it had met its RE Targets, Sep 2024. Alex Hagoveen Rutter. https://energywithalex.wordpress.com/2024/09/07/how-much-would-india-have-saved-if-it-had-met-its-re-targets-updated/
- Sunita Narain et al. 2024, Centre for Science and Environment. The Indian Carbon Market. https://www.cseindia.org/the-indian-carbon-market-pathway-towards-an-effective-mechanism-12328
- Dev Chatterjee et all. 2024, Leading renewable energy firms in India seek buyers for 20 GW assets.
https://www.business-standard.com/industry/news/renewable-power-companies-seek-buyers-for-20-gw-of-projects-124100300484_1.html - Mallya, Hemant, et al. 2024, Unlocking India’s RE and Green Hydrogen Potential: An Assessment of Land, Water, and Climate Nexus.. New Delhi: Council on Energy, Environment and Water. https://www.ceew.in/publications/how-can-india-unlock-renewable-energy-and-green-hydrogen-potential
- Imaging Energy with beckn. https://becknprotocol.io/imagining-energy-with-beckn-protocol/#:~:text=To%20mitigate%20fragmentation%20in%20the,energy%20services%20and%20its%20derivatives.
- Perseus by IB1, 2024. https://ib1.org/perseus/executive-summary/

Archit Varshney
LokNeeti Class of February 2024
Archit is a Lokneeti alum from ISPP. With a continued intent to sharpen his policy examination muscle towards real-world impact at the intersection of society, government and markets, this article expands on his final Practicum submission on the Energy Conservation Amendment Bill of India, 2022.
LinkedIn: https://in.linkedin.com/in/archit-varshney
Twitter: https://x.com/arcquittal